$GPWGT,<FixStatus>,DD.MMMMM,d,DDD.MMMMM,d,<Altitude>, <COURSES>,<SPEED>,<NameId>,<SCODE>,<GroupId>,<Status>,<ICON>,<Date>,<Time>*CC<CR><LF>
March 23, 2010
How to create a multi-unit tracking application
I am currently working on an application that will allow users to track any number of GPS enabled radios within a specified group. The key to this application is the proprietary GPWGT NMEA string which not only has GPS location info but also an identifier. These strings are typically transmitted from each radio in a group or polled by a central radio in a group. This string has the basic construct of
$GPWGT,<FixStatus>,DD.MMMMM,d,DDD.MMMMM,d,<Altitude>, <COURSES>,<SPEED>,<NameId>,<SCODE>,<GroupId>,<Status>,<ICON>,<Date>,<Time>*CC<CR><LF>
$GPWGT,<FixStatus>,DD.MMMMM,d,DDD.MMMMM,d,<Altitude>, <COURSES>,<SPEED>,<NameId>,<SCODE>,<GroupId>,<Status>,<ICON>,<Date>,<Time>*CC<CR><LF>
August 20, 2009
Building an Effective open source GIS application - Chapter I
Recently I was thinking about what goes in to building of a GOOD GIS application, open source or otherwise. I have been involved in creating a number of applications, both web based and desktop, and think I am fairly adept at planning the development of such things, but what really goes in to making a useful open source GIS application. This has lead me to dedicate the next four blog posts to looking at the art of designing, developing and deploying an effective GIS using open source technologies. The first chapter touches on the pre-planning and information gathering stage, Chapter II will look at the planning stage, the third chapter is dedicated to the development phase (looking at the process and is not technical), and finally the last chapter will look at deployment and the issues surrounding this critical stage.
Chapter I: Know your audience?
There is an old adage in the newspaper industry that goes something like "Always write to the lowest common denominator". What I understand this to mean is, don't use a bunch of technical jargon which will confuse the general public. This concept is equally important when building a GIS application. You need to understand who will be using the application and what it will be used for.
I guess the first question to be asked is what does the thing need to do. This seems like an obvious question but, in my experience, many application developers don't fully understand what their application needs to do, I mean REALLY understand what it needs to do. This is not an exercise of putting a list of features together that will go into the software. That list should spawn out of a true understanding of what the software needs to accomplish and who will use it. The second part is possibly the most important question that MUST be answered prior to building the application. You must understand whether the application will be used by technical practitioners, non-technical management, non-technical other and so on. Once you understand who will use the application then you can better understand what the application must do.
Example:
Your boss, a technical GIS practitioner, comes to you and says you need to build an application that will allow the user to track a set of assets by grabbing coordinates from a GPS and giving the user the ability to update attribute values on the fly, now go build it. Sounds easy, you need to build an application that can connect to a GPS unit, read the NEMA strings (or equivalent), plot on a map, allow the user to update field values on the fly and convert to a format that can be used in other GIS or web mapping applications. Simple right? Just find out what the assets are and go build it. Now wait a minute. What kind of data collection will it be used for? Environmental monitoring? Engineering? Search and rescue? This is extremely important because it may allow the developer to limit any of the presets to values specific to the target industry. Perhaps some predefined values in pull downs to populate field values and that sort of thing. And what is the level of GIS knowledge of the user? If they are experts you may be able to build the application as a plug-in or add on for an existing application such as QGIS. These are just a couple of reasons why it is imperative to understand the end users needs.
The image on the right is a screen capture of the Quantum Navigator plug-in for QGIS. This plug-in is still in development but will be intended to track GPS input in real time and allow the user to update values, translate between points and tracks and output different data types. The application is being written in Python so will integrate with any operating sy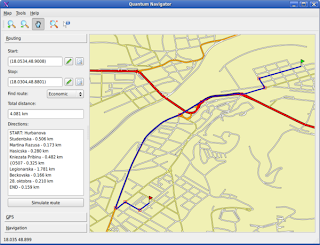 stem. The application is intended to give quick route analysis capabilities to the user will allowing them to add their own data and integrate open street map. This application shows great promise but is intended for the user that may be interested in looking for a optimal route from a specified location to another. This application would not provide all of the functionality that an environmental monitoring team might need for example. Now this application is intended for a very broad audience so it probably meets the objectives of its developers but it helps to illustrate the need to intimately understand your end users requirements. If you were wanting this application to be adequate for an environmental consultant, for example, you would need to add the capabilities to update attribute values and even provide a series of preset values for certain fields. Capabilities that can only be added with intimate knowledge of the intended use.
What should I ask?
So after the this seemingly endless diatribe lets try to understand who the end user is and what questions should I ask that user. So who is going to use this application? Sometimes the initiator of the project will know exactly who the end user will be and what they will user the application for. In this case you as a developer can simply ask them, "Who is the end user and what will they be using the application for". However, quite often it is unclear who all of the users will be and, if you don't know who's using it, how can you know what they need. In these cases it requires some detective work and some of the things you should know up front are:
I hope you found this chapter to be informative and will come back for the next post.
Chapter I: Know your audience?
There is an old adage in the newspaper industry that goes something like "Always write to the lowest common denominator". What I understand this to mean is, don't use a bunch of technical jargon which will confuse the general public. This concept is equally important when building a GIS application. You need to understand who will be using the application and what it will be used for.
I guess the first question to be asked is what does the thing need to do. This seems like an obvious question but, in my experience, many application developers don't fully understand what their application needs to do, I mean REALLY understand what it needs to do. This is not an exercise of putting a list of features together that will go into the software. That list should spawn out of a true understanding of what the software needs to accomplish and who will use it. The second part is possibly the most important question that MUST be answered prior to building the application. You must understand whether the application will be used by technical practitioners, non-technical management, non-technical other and so on. Once you understand who will use the application then you can better understand what the application must do.
Example:
Your boss, a technical GIS practitioner, comes to you and says you need to build an application that will allow the user to track a set of assets by grabbing coordinates from a GPS and giving the user the ability to update attribute values on the fly, now go build it. Sounds easy, you need to build an application that can connect to a GPS unit, read the NEMA strings (or equivalent), plot on a map, allow the user to update field values on the fly and convert to a format that can be used in other GIS or web mapping applications. Simple right? Just find out what the assets are and go build it. Now wait a minute. What kind of data collection will it be used for? Environmental monitoring? Engineering? Search and rescue? This is extremely important because it may allow the developer to limit any of the presets to values specific to the target industry. Perhaps some predefined values in pull downs to populate field values and that sort of thing. And what is the level of GIS knowledge of the user? If they are experts you may be able to build the application as a plug-in or add on for an existing application such as QGIS. These are just a couple of reasons why it is imperative to understand the end users needs.
The image on the right is a screen capture of the Quantum Navigator plug-in for QGIS. This plug-in is still in development but will be intended to track GPS input in real time and allow the user to update values, translate between points and tracks and output different data types. The application is being written in Python so will integrate with any operating sy
 stem. The application is intended to give quick route analysis capabilities to the user will allowing them to add their own data and integrate open street map. This application shows great promise but is intended for the user that may be interested in looking for a optimal route from a specified location to another. This application would not provide all of the functionality that an environmental monitoring team might need for example. Now this application is intended for a very broad audience so it probably meets the objectives of its developers but it helps to illustrate the need to intimately understand your end users requirements. If you were wanting this application to be adequate for an environmental consultant, for example, you would need to add the capabilities to update attribute values and even provide a series of preset values for certain fields. Capabilities that can only be added with intimate knowledge of the intended use.
What should I ask?
So after the this seemingly endless diatribe lets try to understand who the end user is and what questions should I ask that user. So who is going to use this application? Sometimes the initiator of the project will know exactly who the end user will be and what they will user the application for. In this case you as a developer can simply ask them, "Who is the end user and what will they be using the application for". However, quite often it is unclear who all of the users will be and, if you don't know who's using it, how can you know what they need. In these cases it requires some detective work and some of the things you should know up front are:
- What information are you hoping to gather?
- What asset(s) is this information attached to?
- Traditionally, who has collected this data?
- Which GIS applications are already being used? (you should probably already know this information)
- How will the resultant data be stored (e.g. PostgreSQL, Oracle etc.)
I hope you found this chapter to be informative and will come back for the next post.
July 6, 2009
MapWindow Release Candidate 2 Announced
The MapWindow Version 4.7 RC2 has now been released. This is a good sign and seems to indicate the time line for the final release (October 2009) will be attainable. I have notice some bugs have been fixed for this RC including cleaner install on Vista machines and some issues around cartographic elements like exporting the scale bar and north arrrow. A couple of bugs that are still to be resolved at this point are previous zoom issues and incorrect scale bar showing for printing and previewing maps.
All in all this release (4.7) promises to be a significant improvement on 4.5. There has also been significant movement on version 6.0 which is being developed in parallel with the current version. Visit http://www.mapwindow.org for more details.
All in all this release (4.7) promises to be a significant improvement on 4.5. There has also been significant movement on version 6.0 which is being developed in parallel with the current version. Visit http://www.mapwindow.org for more details.
June 24, 2009
Converting coordinates to a local SRS
I am currently doing some work for a small junior mining company which requires that a number of data sets be translated between UTM NAD83 Zone 11 and a local coordinate system. If you have never had any dealings with mining projects you may not know that it is common practice to create a local coordinate system aligned to the estimated ore body (sometimes called a mine grid). In some cases this CS may have been developed many years previous when the mine was originally developed and, often times, there is no adequate documentation to help define the system. If you are lucky you may be able to establish shift, rotation and scale values but this will likely require the assistance of a surveyor.
In this case, however, I was lucky enough to have the translation parameters. As it is very difficult to use traditional methods to convert from a earth centered to non-earth reference system I decided it would be much easier to do the transformation in a more manual fashion. By this I mean an x/y shift and rotation (no scaling required). Now having said that I also realized that this was a task that would be required many more times as the project progressed. For this reason I decided to roll up my sleeves and create a little stand alone utility. This is always a little daunting during an active project but I felt it could be accomplished fairly quickly and for very little additional cost to the client as I was going to utilize the open source ActiveX MapWinGIS and SharpMap dlls to do most of the work for me. After some fairly basic survey geometry calculations I had an algorithm that could be applied to convert all UTM coordinates to the local grid and vise versa.
Now to put it into a utility that would convert the features in a shapefile using this algorithm. As I am very familiar with MapWinGIS and SharpMap, I decided these would be the ideal ActiveX libraries to perform this task. It was fairly simple as the MapWinGIS dll provides read/write access to many of the attributes of features (shapes) such as the x and y coordinates of the individual vertices (points). The conversions can be applied to the vertices very simply such as:
MapWinGIS.Shape s = osf.Shape(shpindex);
string[] xy = toMine(s.Point(k).x, s.Point(k).y);
Where toMine is a Private Function within the VB.NET class that performs the conversion and s is the current feature (shape). The string array xy() will then hold the converted coordinates that can be applied to the shape point as follows:
s.Point(k).x = xy[0]
When all is complete you will have a new data set with all the features "projected" to the local coordinate system. Now the geologists and engineers using sophisticated modeling software (that apparently cannot easily do this kind of conversion) can quickly and easily convert the data for use in resource estimates and mine design applications.
One other issue lay in the fact that many of the data sets might be provided in other data types (i.e. MapInfo TAB files). For this reason I chose to use the open source GIS ActiveX dll SharpMap. This allowed me to convert these files into a common format (ESRI Shapefile).
This example illustrates how easy it is to create a versatile tool box using open source applications and libraries without having to bother with expensive licensing. MapWinGIS has been developed to work seamlessly within the .NET framework so, once you have referenced the dll, you can easily access all of these calls. I suggest downloading all the files from http://www.mapwindow.org or http://www.codeplex.com/SharpMap and try it out. I think you will find they will become an invaluable tool in your GIS toolbox.
In this case, however, I was lucky enough to have the translation parameters. As it is very difficult to use traditional methods to convert from a earth centered to non-earth reference system I decided it would be much easier to do the transformation in a more manual fashion. By this I mean an x/y shift and rotation (no scaling required). Now having said that I also realized that this was a task that would be required many more times as the project progressed. For this reason I decided to roll up my sleeves and create a little stand alone utility. This is always a little daunting during an active project but I felt it could be accomplished fairly quickly and for very little additional cost to the client as I was going to utilize the open source ActiveX MapWinGIS and SharpMap dlls to do most of the work for me. After some fairly basic survey geometry calculations I had an algorithm that could be applied to convert all UTM coordinates to the local grid and vise versa.
Now to put it into a utility that would convert the features in a shapefile using this algorithm. As I am very familiar with MapWinGIS and SharpMap, I decided these would be the ideal ActiveX libraries to perform this task. It was fairly simple as the MapWinGIS dll provides read/write access to many of the attributes of features (shapes) such as the x and y coordinates of the individual vertices (points). The conversions can be applied to the vertices very simply such as:
string[] xy = toMine(s.Point(k).x, s.Point(k).y);
One other issue lay in the fact that many of the data sets might be provided in other data types (i.e. MapInfo TAB files). For this reason I chose to use the open source GIS ActiveX dll SharpMap. This allowed me to convert these files into a common format (ESRI Shapefile).
This example illustrates how easy it is to create a versatile tool box using open source applications and libraries without having to bother with expensive licensing. MapWinGIS has been developed to work seamlessly within the .NET framework so, once you have referenced the dll, you can easily access all of these calls. I suggest downloading all the files from http://www.mapwindow.org or http://www.codeplex.com/SharpMap and try it out. I think you will find they will become an invaluable tool in your GIS toolbox.
June 3, 2009
Google Sites with Gadgets for Project Management
I know this isn't strictly speaking geospatial, however, I am called upon to provide project management services on a fairly regular basis and I believe any GIS manager, consultant or technician will have to do this from time to time. I have recently been re-introduced to Google Sites as a viable tool for this purpose. My most recent discovery was of a Google Gadget by Viewpath simply called Gantt Chart. This cool little gadget lets you create a work schedule that can be used to create a very nice little Gantt chart. (see the YouTube vid at http://www.youtube.com/watch?v=IGwXQryI2-A).
On top of the gadgets there are lots of resources on Google Sites to add lists, documents, presentations, files and much more. I was recently awarded a development project that is estimated to last 2 1/2 to 3 months and I was able to develop a PM site for it in about an hour. Now there is an ongoing conduit for all players to collaborate, communicate and share. And with the sharing capabilities it is easy to keep the project information private.
I suggest anyone who is taking on projects check out the capabilities of Google Sites.
May 8, 2009
Leverage the power of PostGIS in QGIS with PgQuery
As many of you may already know I have created a Python plugin for QGIS called PgQuery which gives easy access to powerful PostGIS geoqueries within the QGIS environment. Well it's finally here and you can download it by navigating to the downloads section @ http://www.carteryx.com/.
Today I would like to go over how to install and use this tool with the hope that it will become a great help to all those wanting to leverage the power of OSGIS in their organization.
Install
First method: Installing this package really couldn't be any easier. After downloading the archive file unzip it to the user specific Python Plugin directory (C:\Users\
\.qgis\python\plugins). Currently the plug-in doesn't support installation to the main QGIS Python plugins directory.
Second method: You can also install PgQuery by opening QGIS and selecting the Fetch Plugins item under the Plugins menu. In the resulting dialog select the PgQuery for QGIS entry and select the Install/upgrade plugin button.
After doing either one of these methods you can activate the plugin using the QGIS Plugin Manager (PM). It will then show in PM as PgQuery for QGIS (Version 0.1.1. You can just select this plugin and you will see a new entry for PgQuery under plugins as well as an icon on the tool bar.
Running PgQuery
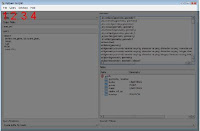
To run the app either select PgQuery for QGIS from the plugins menu or the icon from the tool bar. When the application opens you will see a number of controls on the main form:
You will also need to have PyQt and Python for QGIS installed. All of these can be installed using the online stack builder that comes with the OSGeo4W installation. Make sure to read the INSTALL.txt file that comes bundled with the plug-in.
You will also find a help document in the "docs" folder of the pgquery_plugin directory. this help doc is called help.html which can be opened in any browser and gives you some guidance for using this tool.
Try it out and see how powerful PostGIS can be in your enterprise GIS environment. This enterprise database application has hundreds of spatial functions that allow you to perform myriad geoprocessing and analytical tasks. For more assiatance on PostGIS you can go to http://postgis.refractions.net/ and look at the documentation available there.
I hope you find this tool very useful and that it brings enterprise GIS into the reach of ANY organization regardless of size of budget.
Today I would like to go over how to install and use this tool with the hope that it will become a great help to all those wanting to leverage the power of OSGIS in their organization.
Install
First method: Installing this package really couldn't be any easier. After downloading the archive file unzip it to the user specific Python Plugin directory (C:\Users\
Second method: You can also install PgQuery by opening QGIS and selecting the Fetch Plugins item under the Plugins menu. In the resulting dialog select the PgQuery for QGIS entry and select the Install/upgrade plugin button.
After doing either one of these methods you can activate the plugin using the QGIS Plugin Manager (PM). It will then show in PM as PgQuery for QGIS (Version 0.1.1. You can just select this plugin and you will see a new entry for PgQuery under plugins as well as an icon
 on the tool bar.
Running PgQuery
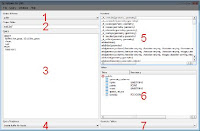
To run the app either select PgQuery for QGIS from the plugins menu or the icon from the tool bar. When the application opens you will see a number of controls on the main form:
- An Output Schema pull down to allow you to select the schema of any output tables
- An Output Table box which is self explanitory
- A Query box which allows you to create queries from scratch, add query components from some of the other controls, or select a query template from the Query Template pull down.
- A Query Template pull down as described in 3. When you select a query template it builds the query for you from the pre loaded queries or from a query that you have built and saved to the default location.
- A Functions list box which allows you to double click to add functions to the query at your current cursor location.
- A Tables tree control that shows a list of all the tables available in the currently loaded PostgreSQL database. If the table is spatial the geometry type will show in the column beside the Table column. You can also double click the tables to add them to the query.
- Finaly the Geometry Column pull down that allows you to select the geometry column from any of the currently selected tables.
You will also find a number of menu items at the top.
- Under the File menu there are sub menus to allow you to:
- Open an existing project file that will bring you back to a previous state of SQL query development
- A Save and Save As menus to save the appropriate project files
- And, of course, and exit menu to close the application entirely.
- You will find a Query menu containing sub menus that give you access to:
- The Run menu which runs the current query as shown in the query box on the currently active database
- The Save menu to allow the current query to be saved to a Query Template file for later use.
- The Clear menu that allows all query statements to be cleared to start over from scratch.
- And a Check Box that allows the user to select whether or not they want to add the resulting spatial table to be added as a geometry data set to the QGIS map view.
- The Database menu has a listing of all available PostgreSQL database connections in QGIS that the user can select to make current.
- Finally the Help menu gives access to:
- Basic Help with PgQuery for QGIS
- And a basic About PgQuery statement
You will also need to have PyQt and Python for QGIS installed. All of these can be installed using the online stack builder that comes with the OSGeo4W installation. Make sure to read the INSTALL.txt file that comes bundled with the plug-in.
You will also find a help document in the "docs" folder of the pgquery_plugin directory. this help doc is called help.html which can be opened in any browser and gives you some guidance for using this tool.
Try it out and see how powerful PostGIS can be in your enterprise GIS environment. This enterprise database application has hundreds of spatial functions that allow you to perform myriad geoprocessing and analytical tasks. For more assiatance on PostGIS you can go to http://postgis.refractions.net/ and look at the documentation available there.
I hope you find this tool very useful and that it brings enterprise GIS into the reach of ANY organization regardless of size of budget.
March 19, 2009
Who needs ArcMap?
Over the past month I have been working on a Python plugin for Quantum GIS (QGIS) that allows the user to access the geoprocessing functionality of PostGIS without leaving the QGIS environment. I call it PgQuery for QGIS for anyone that might care. I have tried to make the plugin easy and intuitive to use with some click/double click functionality to insert PostGIS functions and tables into the query statements. That is the end of my sales pitch for this open source application, it is currently being tested by some associates and I will release it to the OS community very soon.
I mention this application because it illustrates how powerful open source GIS applications have become. I thought I would make a brief comparison here to give a sense of how many of the traditionally ArcGIS functions are actually "doable" in QGIS with one of the myriad plugins available such as GRASS or PostGIS.
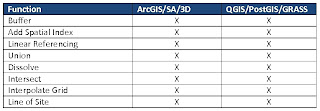
I mention this application because it illustrates how powerful open source GIS applications have become. I thought I would make a brief comparison here to give a sense of how many of the traditionally ArcGIS functions are actually "doable" in QGIS with one of the myriad plugins available such as GRASS or PostGIS.
This table illustrates a few of the geoprocesses that both the ESRI stack and the OS stack handle very well. The only real difference is the cost. The ESRI stack above represents about $25,000 (requires ArcInfo for Linear Referencing and Spatial Analyst for LOS) where as the OS stack is free. I am a firm believer in the right tool for the job and I believe that ESRI still has an advantage in cartographic output but what I think this illustation shows is that you MUST make a proper needs assessment before deciding on a GIS implementation. You may find that your current and future requirments will fit well with an open source deployment that will potentially save you thousands of dollars.
Don't get me wrong, I am not averse to an ESRI or any other commercial vendor deployment. I am only saying that, when looking at developing a GIS, it is worth considering open source as part of that strategy. In fact larger commercial developers such as ESRI and Safe are starting to support open source platforms such as PostgreSQL/PostGIS.
I will be posting a link to the QGIS plugin I mentioned at the begining on this site very soon so check back often. I will also be announcing it's release on Twitter and in a number of LinkedIn formus such as GIS, Geomatics and GIS Professionals so stay tuned.
Subscribe to:
Posts (Atom)